The Elevate
Playbook
How Smart Greens diversified a constrained $102M business into $164M across three revenue streams in twenty-four months — and the turnkey system that built it.
The numbers,
up front
In January 2024, Smart Greens was a $102M wellness business with a large legacy revenue base it was no longer permitted to grow, a good product and no functioning direct channel. Ninety per cent of revenue came from a legacy community-based channel that was capped by regulation across its markets. Ten per cent came from a web store that had not been meaningfully rebuilt since 2019, converted at 1.4%, and could not take a subscription without a phone call.
Twenty-four months later the business runs on three channels instead of one. What follows is the complete account of what changed, what it cost, what worked, and — in a section most case studies omit — what didn't.
Commercial outcomes
| Metric | Q1 2024 | Q2 2026 | Change |
|---|---|---|---|
| Total revenue (TTM) | $102.4M | $163.8M | +60% |
| Legacy channel revenue | $92.2M | $100.1M | flat |
| Diversified revenue (direct + creator) | $10.2M | $63.7M | +525% |
| DTC revenue | $10.2M | $46.4M | +355% |
| Creator & affiliate revenue | — | $17.3M | new |
| Active subscribers | 14,200 | 96,800 | +582% |
| Average order value | $58 | $79 | +36% |
| Gross margin | 71.0% | 74.2% | +3.2pt |
| Contribution margin after CAC | 22.4% | 41.1% | +18.7pt |
Operating outcomes
| Metric | Q1 2024 | Q2 2026 | Change |
|---|---|---|---|
| Blended CAC | $71 | $48 | −32% |
| 12-month LTV | $186 | $412 | +122% |
| Site conversion rate | 1.4% | 3.9% | +179% |
| Month-12 subscriber retention | 19% | 43% | +24pt |
| Systems in the commerce stack | 11 | 3 | −73% |
| Legacy commission structure change cycle | 7 months | 6 days | −97% |
| Time to launch a new market | 14 months | 11 weeks | −81% |
| Partner payout cycle | 30 days | 7 days | −77% |
Why diversification
was the only path
Smart Greens' problem was not demand. It was that its largest revenue stream could not be grown.
Tightening regulation across its markets — on earnings representation, on cross-border payouts, and on how community-based channels may recruit and be compensated — meant the legacy channel could be maintained but not expanded. Two of its six markets had already introduced constraints that made further channel growth impractical. A third was under active review. The channel was not in decline; it was capped.
That is a specific and increasingly common position: a healthy, profitable business with a large revenue base it is not permitted to grow, and no second engine to grow instead.
 Constraint · not decline
Three channels
where there
was one
What the curve shows
- Two flat quarters first. Q1–Q2 2024 show nothing, because nothing was live. The platform work ran for nineteen weeks before a single incremental dollar arrived. Any programme of this shape has a trough, and pretending otherwise is how these projects lose sponsorship in month three.
- DTC inflects in Q3 2024. The product finder and subscription engine went live within eleven days of each other. DTC revenue moved from $2.9M to $5.1M in one quarter — the single largest step change in the programme.
- Creator revenue compounds rather than spikes. It contributed $0.4M in its first quarter and $5.8M in Q2 2026. Creator channels do not scale with spend; they scale with the number of activated partners, which is a recruiting-and-onboarding problem, not a media-buying one.
- The legacy channel line stays flat. It is not in decline; it is capped. Every dollar of growth on the chart comes from the two new lines above it.
Contents
Cost to serve · The North Star · Audience · Range economics
Competitive landscape · Positioning · Pricing architecture
The three-ledger problem · Cost comparison · The four tiers
Email & lifecycle · Website & UX
Unit economics · Creative testing · LTV model

The business
Company overview
Smart Greens launched in 2012 in Salt Lake City as a wellness business built around a single daily greens powder. The founders — a food scientist and a former commercial lead from a legacy nutrition company — built the brand on personal recommendation, and the business grew steadily through a community-based channel that generated most of its early revenue.
It worked. By 2019 the business passed $60M. By 2023 it reached $102M across six markets on a product customers genuinely kept buying, with a repeat purchase rate of 28% — unremarkable for e-commerce, respectable given that the reorder was carried by relationship rather than by any modern retention infrastructure.
What it did not have was a modern direct channel. The web store existed to service the legacy channel, not to acquire customers. It ranked for the brand name and almost nothing else. It could not take a subscription without a phone call to customer service. It converted at 1.4%.

What $9.5M a year
was actually buying
Before anything was built, the first four weeks were spent establishing what the business already spent to operate its commercial and technology stack. This is the number most brands with concentrated legacy revenue cannot produce on request, because it is distributed across eleven vendors, four departments and two capitalisation policies. Smart Greens' figure was $9.47M a year against $102.4M of revenue — 9.2% of revenue, against a sector benchmark of 5–7%.
Cost to serve, FY2023
| Line | Annual | % of total |
|---|---|---|
| Core legacy channel platform (licence + support) | $2.30M | 24.3% |
| E-commerce platform, hosting, apps | $0.94M | 9.9% |
| Internal technology headcount (14 FTE) | $2.18M | 23.0% |
| Systems integrators & contract development | $1.61M | 17.0% |
| Digital, creative & media agencies | $1.42M | 15.0% |
| Payments, tax, compliance tooling | $0.61M | 6.4% |
| Data, BI and reconciliation tooling | $0.41M | 4.3% |
| Total | $9.47M | 9.2% of revenue |
The four findings that set the programme
- Thirty-eight per cent of the spend was integration, not capability. Systems integrators, contract development and reconciliation tooling — $2.02M a year — existed to make eleven systems agree with each other. None of it produced anything a customer could see.
- A legacy commission structure change took seven months and $250K. Not because the change was complex, but because it touched four systems whose release cycles were independent. The 2022 change had been scoped, deferred, rescoped and shipped fourteen months after it was requested.
- Market seven had been stalled for fourteen months. Not on demand, on payout licensing and tax logic. Two prior attempts had been abandoned after $400K of committed spend.
- A creator pilot had been abandoned outright. The platform could not pay a person who was not part of the legacy channel. Eleven creators were recruited in 2023; none were ever paid; the programme was cancelled after four months.

The eleven-system
problem
Smart Greens ran eleven systems that each held part of the commercial truth: the legacy channel engine, the e-commerce platform, a separate subscription app, two payment processors, a tax engine, an email platform, a CRM, a customer-service desk, a warehouse system and a BI layer stitching them together nightly.
Nine reconciliations ran every week, seven of them by CSV, four of them manual. Two full-time analysts existed principally to make numbers agree. The practical consequence was not cost — it was latency. Nobody could answer a question that spanned the legacy channel and the direct customer base in one query, which meant nobody could design an offer that involved both.
- 9 weekly reconciliations, 7 by CSV, 2 automated but unmonitored
- 2.0 FTE whose primary function was reconciliation
- 31 hours average latency from order to reportable attribution
- 4 systems touched by any legacy commission structure change
- 0 queries could span direct customer and legacy channel data without export
 The North Star — diversified revenue composition
The North Star
The board set a five-year target of $500M at a 3× improvement in enterprise value multiple. The multiple mattered more than the revenue: brands with concentrated legacy revenue trade at 0.8–1.4× revenue, hybrid businesses with meaningful recurring revenue trade at 2.5–4×. The same $500M business is worth roughly $600M under one model and $1.6B under the other.
That reframed the goal. The target was not growth in the aggregate. It was changing the composition of the revenue — specifically, building diversified, recurring, first-party revenue while the legacy channel stayed flat, because the legacy line could be maintained but not expanded.
| Revenue composition | 2023 | 2026 | 2029 target |
|---|---|---|---|
| Legacy channel | 90% | 61% | 44% |
| Direct to consumer | 10% | 28% | 38% |
| Creator & affiliate | 0% | 11% | 18% |
| Diversified share of total | 10% | 39% | 56% |
| Recurring share of total | 8% | 39% | 55% |
The diversified share is the operating number. It moved from 10% to 39% in twenty-four months, without any assumption that the constrained line would grow — which is what makes the plan defensible under the regulatory position the business is actually in.
Five segments,
identified
not assumed
Smart Greens does not guess at its segments. Every customer who completes the on-site product finder self-identifies into one of five, and every downstream decision — which reviews are shown, which email journey fires, which creative is served, which SKU is recommended — keys off that answer. The table below is live operating data, not a persona exercise; it is why the finder was the first thing built.
| Segment | Share of new customers | AOV | Sub. take-up | M12 retention | 12-mo LTV | CAC |
|---|---|---|---|---|---|---|
| Daily Foundations | 34% | $74 | 66% | 41% | $388 | $44 |
| Active Performance | 19% | $103 | 74% | 48% | $561 | $61 |
| Family Wellness | 16% | $118 | 81% | 57% | $694 | $72 |
| Frequent Travellers | 13% | $68 | 71% | 44% | $372 | $39 |
| First-Timers | 18% | $52 | 49% | 28% | $196 | $34 |
What the table changed
- Family Wellness was under-served by a factor of four. It was 16% of customers and 27% of contribution, with the highest retention in the book — and had no dedicated bundle, no dedicated creative and no email journey. The Family Pack SKU exists because of this row.
- First-Timers were being over-acquired. Cheapest CAC, worst everything else. Paid social had optimised into them because they convert fastest. Bid strategy was moved off first-purchase conversion and onto predicted 180-day value, and blended LTV rose 19% in two quarters with no change in spend.
- Active Performance justified a price increase. Highest AOV, second-highest retention, lowest price sensitivity in testing. The Performance bundle was repriced up 12% with no measurable change in conversion.
- Travellers convert on format, not formula. They are the only segment where the stick pack outsells the tub on first order — 3.4:1. Serving them tub creative was costing an estimated $340K a year in wasted impressions.



Six SKUs,
one habit
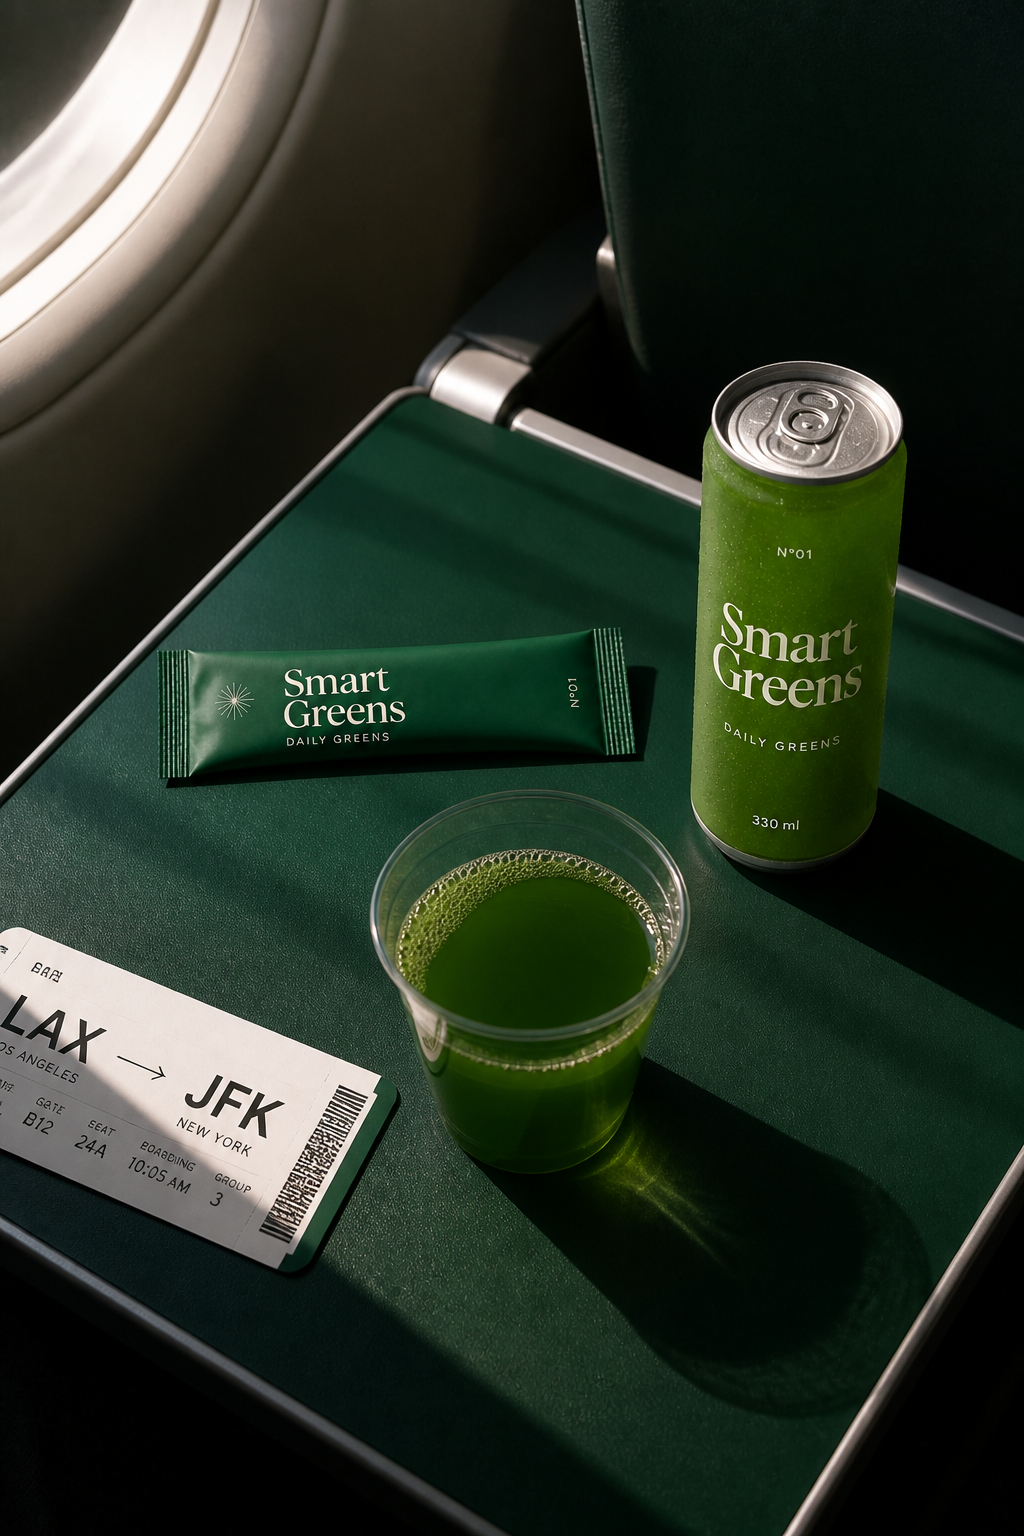
The range is deliberately narrow. Every SKU resolves to the same daily action, which is what stops the catalogue fragmenting attention and lets a single product finder route the entire audience. Margin discipline is enforced at the bundle level rather than the unit level: the Starter Kit runs at a deliberately thin margin because it is the highest-converting first purchase in the range and the strongest predictor of month-twelve retention.
| SKU | Price | Per serve | Gross margin | % of units | % of revenue | Sub. attach |
|---|---|---|---|---|---|---|
| Daily (30-serve tub) | $79 | $2.63 | 76% | 41% | 38% | 71% |
| Starter Kit | $89 | $2.97 | 58% | 22% | 23% | 84% |
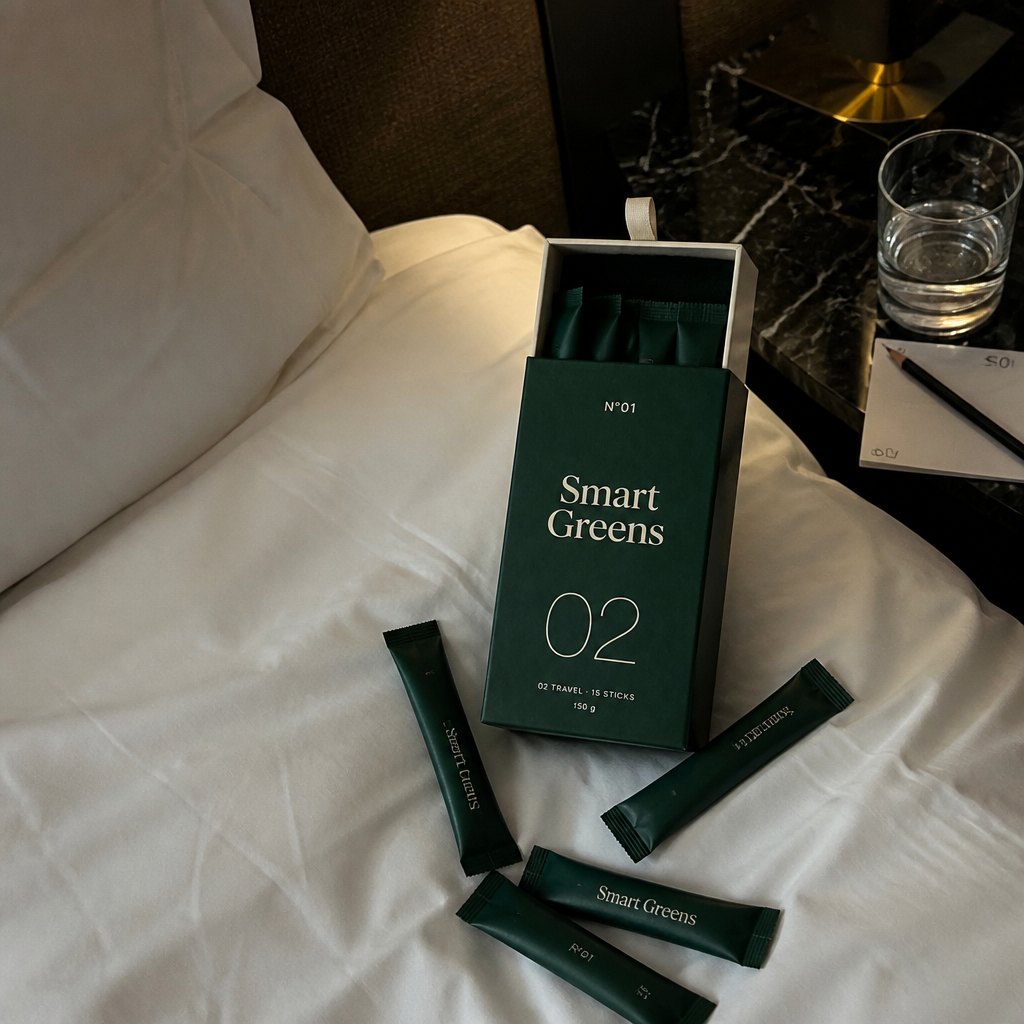
| 02 Travel (15 sticks) | $46 | $3.07 | 72% | 14% | 9% | 52% |
| Daily Duo (2 tubs) | $142 | $2.37 | 78% | 11% | 18% | 88% |
| Family Pack (4 tubs) | $268 | $2.23 | 79% | 6% | 10% | 91% |
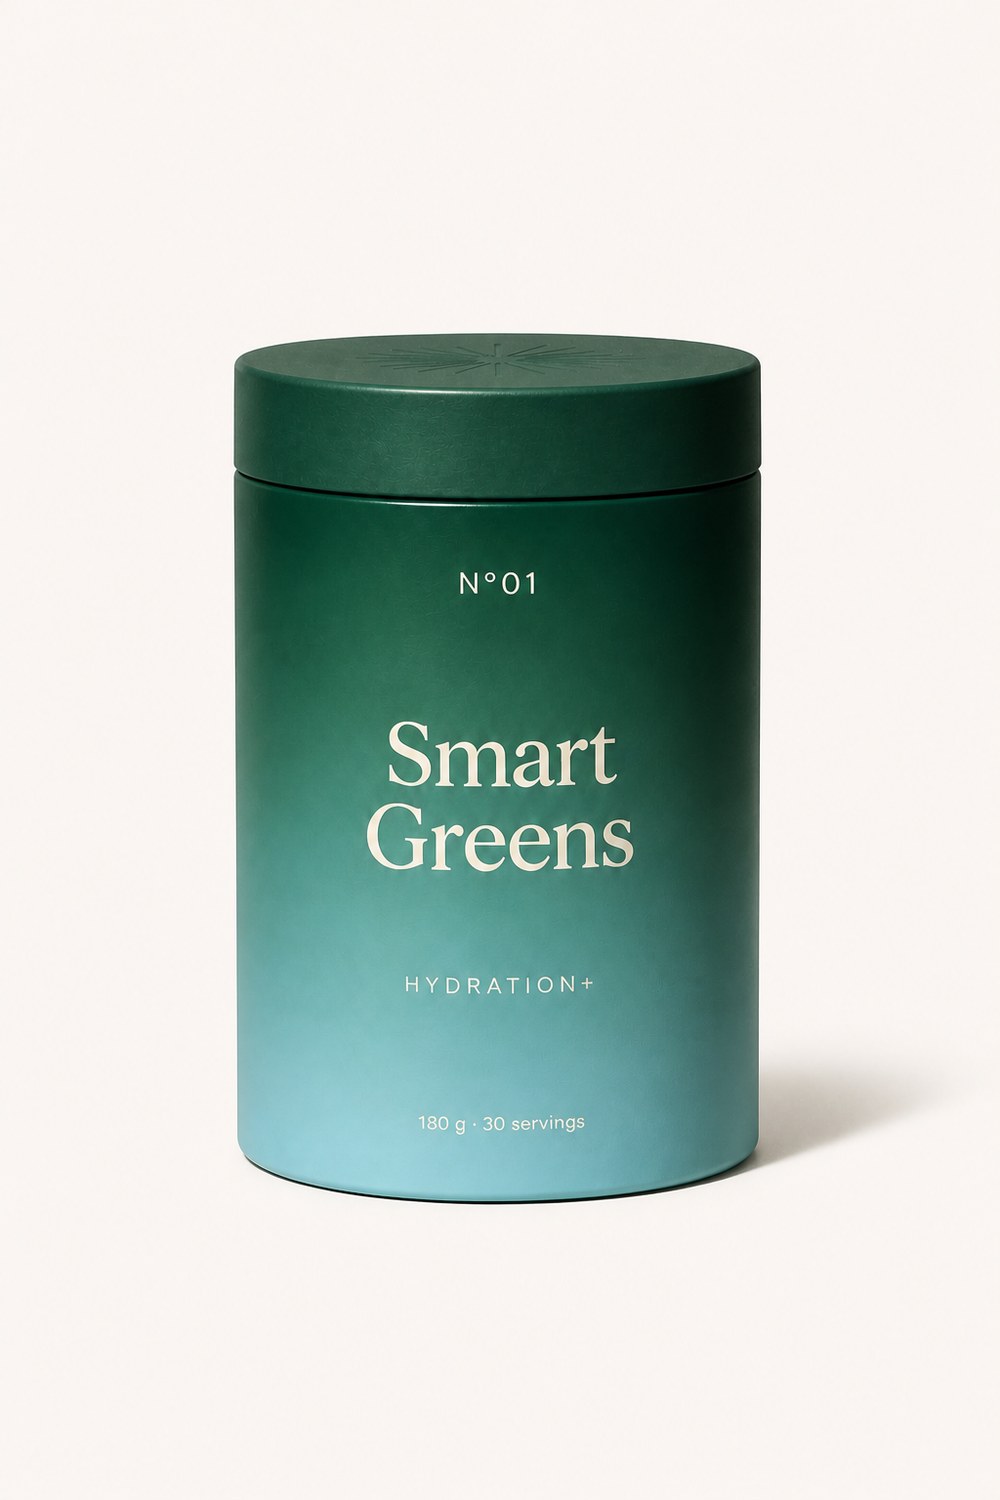
| Hydration+ (seasonal) | $38 | $1.27 | 69% | 6% | 2% | 31% |
Brand strategy
Archetype
& messaging
The Sage, chosen for retention
Smart Greens embodies the Sage — the brand that gives you the information and trusts you to decide. Where most of the category performs enthusiasm, Smart Greens performs precision. The archetype was chosen on retention grounds rather than acquisition grounds: enthusiasm converts a first order and then sets an expectation the product cannot meet by week six. Precision converts more slowly and survives month eleven.
The commercial evidence supports the choice. Customers acquired through educational content convert 31% slower than those acquired through offer-led creative, and retain at month twelve 2.3× better. The entire content ratio — roughly two parts education to one part promotion — is derived from that single trade-off.
Four verbal moves
Every surface, from a product page to a creator's storefront bio, follows the same sequence: name the ingredient, name the source, show the test, let the customer conclude. The line "Daily nutrition made intelligent" claims competence rather than outcome — a statement about how the product is built, not about what it will do to you.
| Never says | Says instead |
|---|---|
| "Boosts your energy" | "72 ingredients, each listed with its source" |
| "Transform your health" | "One habit that survives a difficult week" |
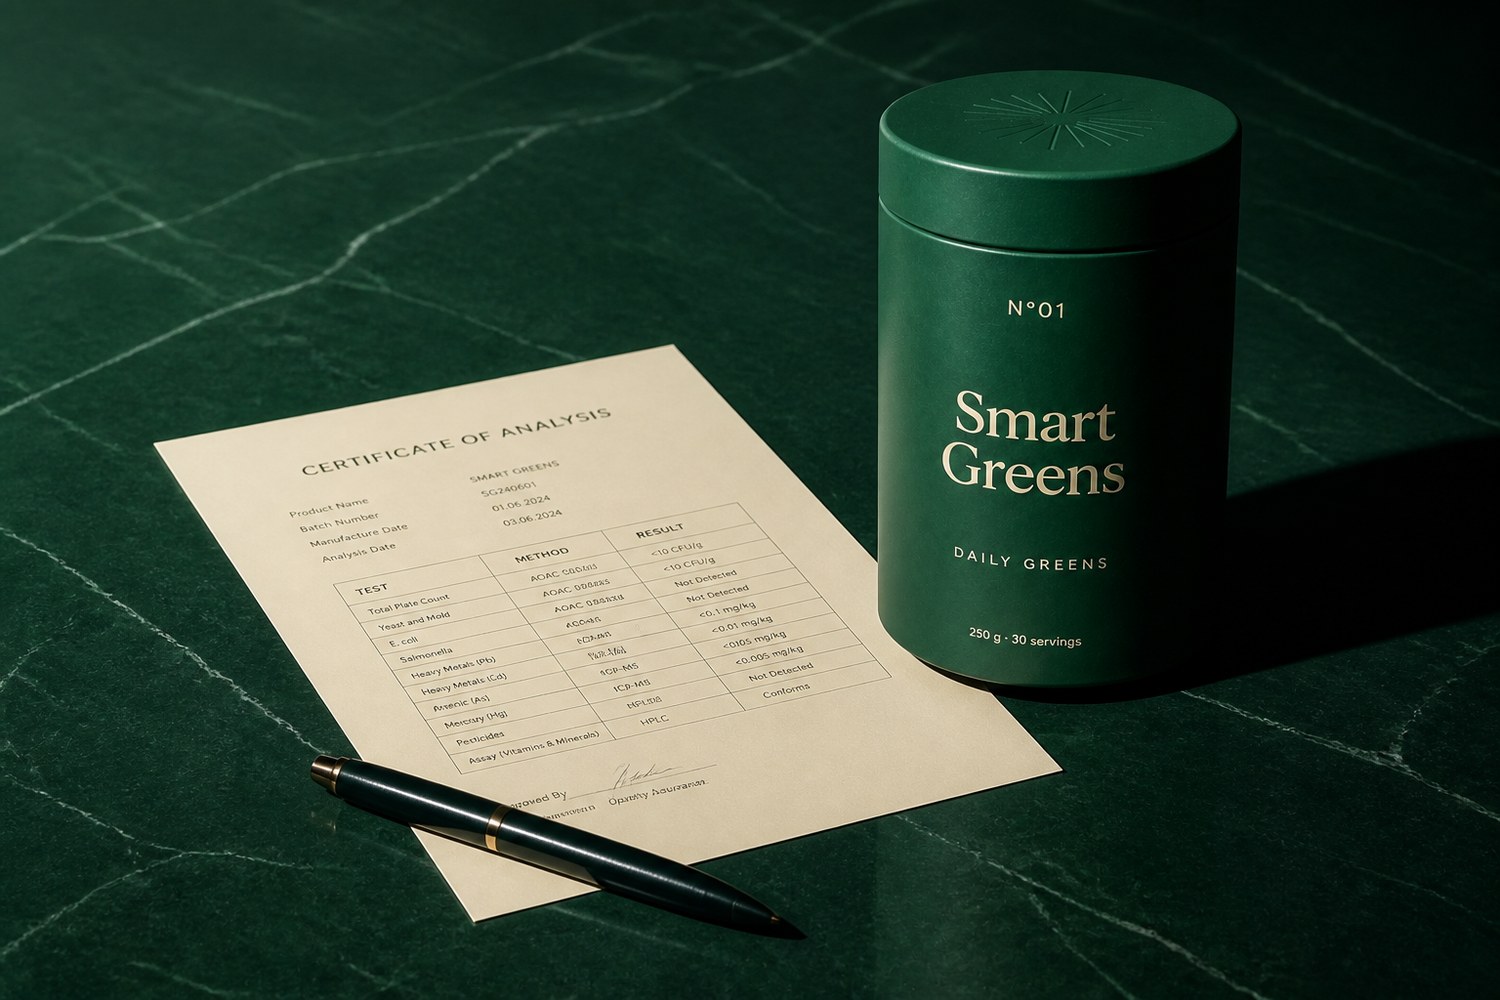
| "Clinically proven" | "Third-party tested every batch — certificates published" |
| "Proprietary blend" | Enzymes listed by name and activity level |
| "Only 3 left — order now" | Nothing. No scarcity mechanic exists on the site. |

Unique selling
proposition
The formula is matchable. Any competent contract manufacturer could approximate 72 ingredients within a quarter. The disclosure is not matchable, because it requires supply-chain relationships most of the category does not have and would not survive publishing.
- Radical traceability. Every ingredient published with its grower or region; every batch third-party tested with the certificate downloadable by batch code from the tub. 14,200 certificate downloads in the last twelve months — and those customers retain 19 points above average.
- Genuine flexibility. Pause, skip, swap and cancel in two taps, stated on the product page rather than buried in terms. Cancellation is a two-tap flow with no retention maze, and the subscription conversion lift from saying so out loud was +11.4% in a clean A/B test.
- One habit, four formats. Tub, stick, duo and family all resolve to the same daily action, so the range never fragments attention or splits the content calendar.
- No proprietary blend. Enzymes listed by name and activity. Hiding quantities behind a blend is a category tell; refusing to do it is the cheapest positioning asset the brand owns.
In a category that competes on claims, Smart Greens competes on things that can be checked.
Three competitors,
three different
advantages
Smart Greens operates in a crowded premium greens market. The instructive thing about its competitive set is that each competitor is strong in a genuinely different dimension, which means there is no single counter-position — there are three. Figures below are public or reasonably estimated from public sources and are used as market context.
| Smart Greens | AG1 | Huel | Bloom | |
|---|---|---|---|---|
| Established | 2012 | 2010 | 2015 | 2019 |
| Category | Daily greens | Foundational nutrition | Complete food | Greens & gut health |
| Primary acquisition engine | Legacy + creator + finder | Podcast + expert authority | Community + UGC | Social velocity (TikTok) |
| Entry price point | $79 | $99 | $45 | $40 |
| Ingredient count disclosed | 72, all sourced | 75, blend-level | n/a — macro-led | ~30, blend-level |
| Batch certificates published | Yes, by batch code | Summary only | Summary only | No |
| Proprietary blend used | No | Partially | No | Yes |
| Existing advocacy network | Established legacy channel | Paid ambassadors | Organic community | Paid creators |
| Estimated core weakness | Brand awareness | Price and ad fatigue | Positioning drift | Retention |
AG1
Key facts
- Established: 2010 · Category: daily foundational nutrition
- Flagship: AG1 daily powder, 75 ingredients, ~$99 entry
- Core strategy: named scientific authority plus podcast saturation at a scale most legacy-channel businesses are not structured to match.
- Where it is strongest: ubiquity and credibility-by-association. It is the default answer to "which greens powder", which is worth more than any single campaign.
- Where it is exposed: price sensitivity at $99, ad fatigue in a saturated podcast market, and a disclosure posture that summarises rather than publishes.
- Smart Greens' counter: do not out-spend — out-specify. Publish per-batch certificates and per-ingredient sourcing that AG1 summarises, and win the sceptic who reads before buying. That customer is 18% of the market and 34% of twelve-month contribution.
Huel
Key facts
- Established: 2015 · Category: nutritionally complete food
- Flagship: Huel Powder, plant-based complete nutrition, ~$45 entry
- Core strategy: genuine community and user-generated content at volume, supported by one of the most disciplined design systems in consumer health.
- Where it is strongest: brand coherence and community authenticity. Its customers make its content, which is a structurally cheaper acquisition model than either paid social or podcast.
- Where it is exposed: positioning drift — meal replacement, snack, and supplement occasions compete for the same shelf and the same message.
- Smart Greens' counter: borrow the system discipline and the UGC mechanics wholesale; reject the meal-replacement positioning entirely. Smart Greens sits alongside food, not instead of it, and that clarity is worth more than the incremental occasion.

Bloom
Key facts
- Established: 2019 · Category: greens and gut health
- Flagship: Greens & superfoods powder, ~$40 entry
- Core strategy: social-first velocity — heavy TikTok presence, creator seeding at scale, and a flavour-led product experience aimed at a younger buyer.
- Where it is strongest: speed and cost of reach. Bloom demonstrated that seeded creator content can build a nine-figure brand faster than paid media can.
- Where it is exposed: retention. A flavour-led, trend-led acquisition motion produces a customer who leaves when the trend does.
- Smart Greens' counter: take the creator mechanics — the seeding cadence, the storefront model, the volume of assets — and point them at an older, higher-value buyer whose reason to stay is the routine rather than the flavour.
Price is the
positioning
Smart Greens sits $20 below AG1 and roughly $35 above Bloom. That gap is deliberate and defended: below AG1 it is a credible alternative rather than a discount imitation; above Bloom it does not compete for a customer who leaves. The architecture has three rules, and all three cost money in the short term.
- The subscription price is the real price. 68% of orders are subscription orders, so the subscription price is quoted everywhere as the headline. The one-time price exists, is visible, and is never the number on the ad.
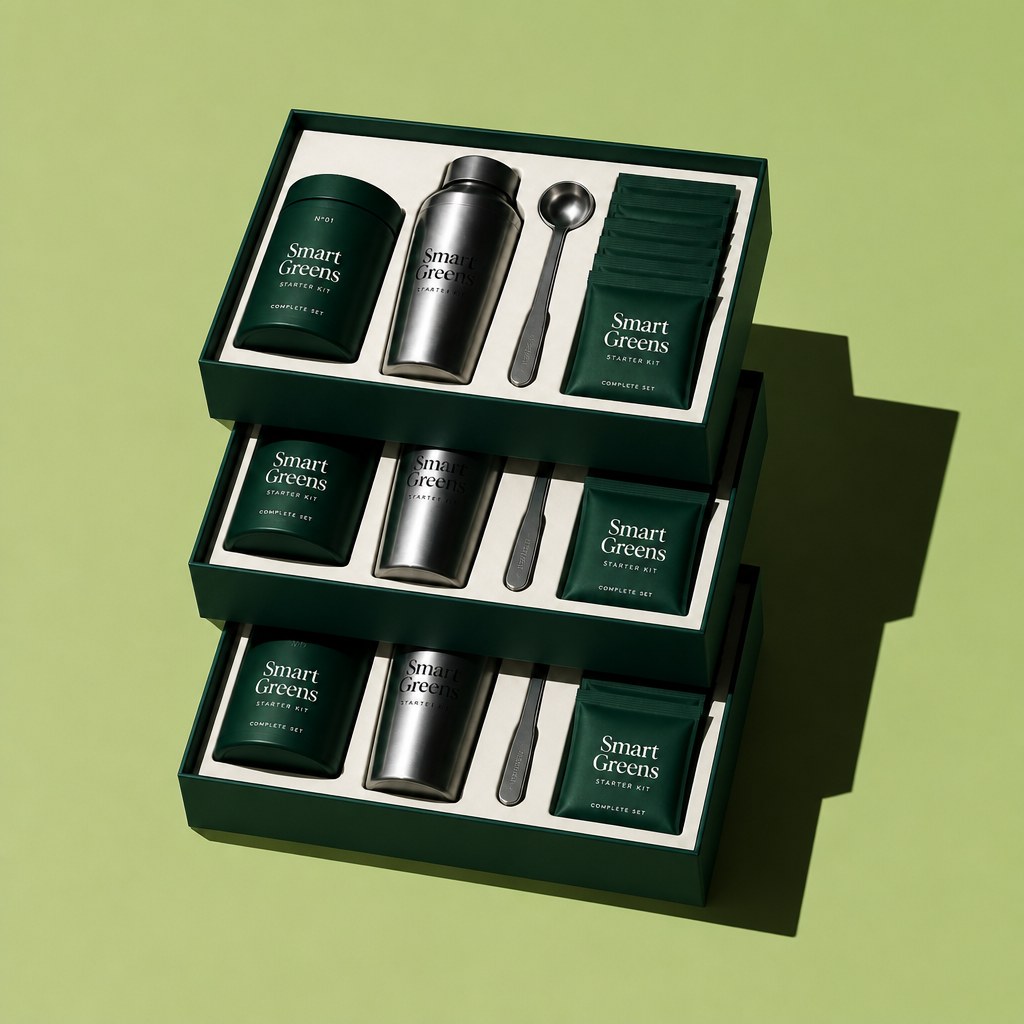
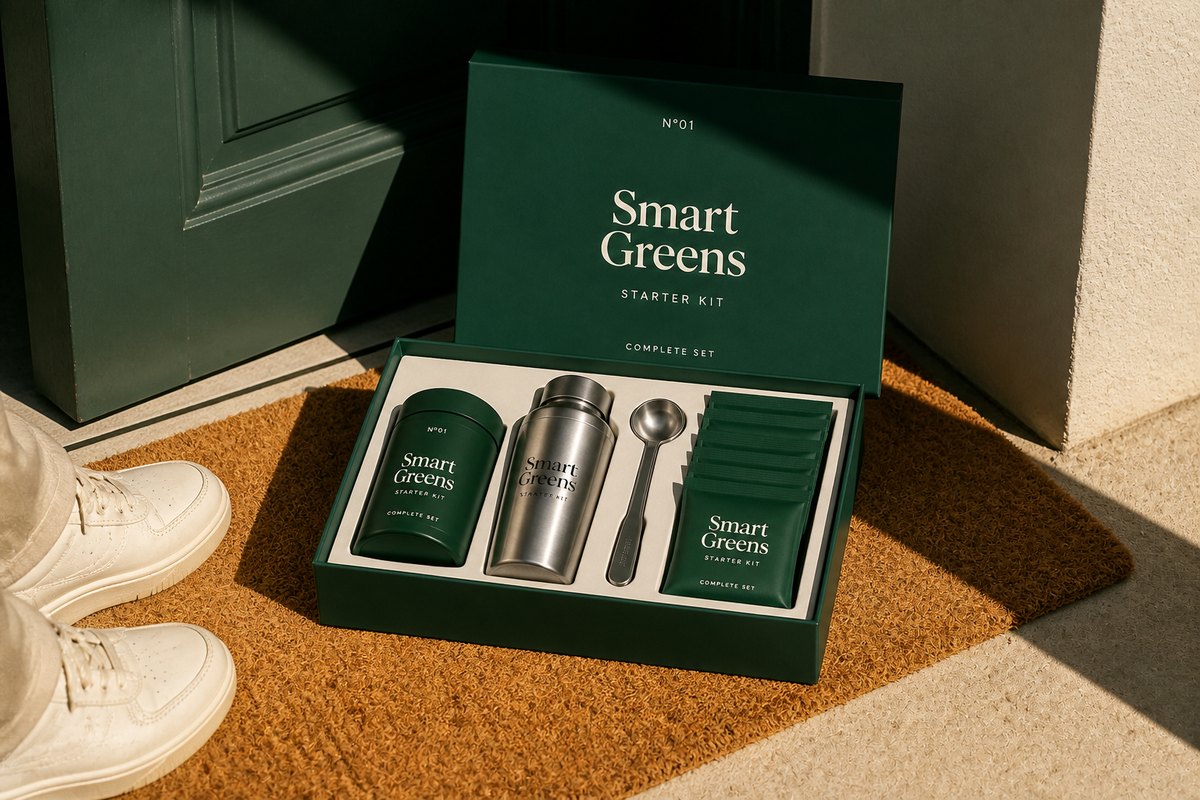
- No promotional discounting, ever. Smart Greens has run zero sitewide sales since March 2024. The welcome kit — shaker, scoop, five travel sticks, $34 of physical value at $11 of cost — replaced the discount entirely. Contribution per first order rose $9.20 and the customers acquired retain 8 points better.
- Volume value is structural, not promotional. Per-serve price falls from $3.07 on sticks to $2.23 on the Family Pack. The discount lives in the range architecture, where it builds order value permanently, rather than in a campaign, where it trains the market to wait.
The transformation
The three-ledger
problem
Smart Greens' technical problem was not that its systems were old. It was that hybrid commerce requires three fundamentally different commercial models to settle against the same inventory, the same customer record and the same tax position — and almost no platform is built to do that.
Three models, one business
- The legacy channel model pays commission on introductions and settles on a monthly cycle governed by a legacy commission structure that can change.
- The direct model pays nobody, needs subscription billing, dunning, proration and self-serve amendment, and settles instantly.
- The creator model pays a flat or tiered commission to a partner outside the legacy channel, on verified sale rather than click, in whatever market they happen to live in.
Run these on separate systems and the failure mode is immediate and specific: a customer introduced by the legacy channel, who later buys through a creator's storefront, whose subscription then renews direct. Who gets paid? Under Smart Greens' 2023 stack the answer was nobody, twice, and a ticket was filed. That exact scenario occurred 1,840 times in 2023 and was resolved manually every time.
What Elevate One resolved it with
- A single commercial ledger. One order record carries every attribution claim against it — introducing legacy channel partner, referring creator, acquisition channel, subscription lineage — and the payout engine resolves them by rule rather than by ticket.
- A configurable attribution hierarchy. Smart Greens' rule: the introducing legacy channel partner retains a 4% commission for eighteen months regardless of subsequent channel; the creator earns full commission on the order they source. Both are paid. The margin cost is 2.1 points and it ended the conflict permanently.
- Payout as a shared service. Legacy channel partners, creators and affiliates are paid by one engine across six markets and four currencies, with the tax and licensing logic held once rather than per-channel.
- Legacy commission structure as configuration. Plan rules moved out of code. The change that took seven months in 2022 was made in six days in 2025, and tested against a twelve-month replay of live orders before it shipped.
What was built,
in what order
The sequence matters more than the components. Creator and referral infrastructure shipped before paid social — not because they were more valuable, but because launching acquisition before the organic proof exists is how these programmes generate cost with no return in the quarter that matters. Expand any phase for what shipped and what it returned.
WEEKS 1–4Phase 0 — Diagnostic and commercial model+
- Full cost-to-serve reconstruction across eleven systems and four departments — produced the $9.47M baseline that funded the programme.
- Twelve-month order replay to establish true channel attribution, which revealed 1,840 unresolved multi-claim orders.
- Cohort reconstruction from 2021 onward — the analysis that killed promotional discounting.
- Commercial governance established before any build decision. Six working sessions across the business and its partners, and one non-negotiable outcome: every new channel would be additive to legacy revenue, never in competition with it.
Revenue impact: $0. This phase produced no customer-visible change and is the phase most programmes skip.
WEEKS 5–19Phase 1 — Commerce foundation, home market+
- Unified ledger and attribution hierarchy live; eleven systems reduced to three.
- Subscription engine with self-serve pause, skip, swap and two-tap cancel.
- Product finder built and shipped — six questions, routing to segment, SKU, frequency and offer.
- Rebuilt PDP with inline ingredient cards, per-batch certificate lookup and segment-matched proof.
- Creator and affiliate storefront infrastructure built and provisioned as a shared service rather than as bespoke integrations.
Revenue impact: DTC quarterly revenue $2.9M → $5.1M. Site conversion 1.4% → 2.6%. Subscription take-up on new orders 31% → 54%.
WEEKS 20–34Phase 2 — Creator OS and lifecycle+
- Creator operating system: discovery, outreach, gifting, briefing, rights capture, approval, storefront and payment in one workflow.
- First 90 creators activated; "30 Days of Better Routines" programme launched.
- Seven lifecycle journeys built on unified data — first time email could reference subscription state and legacy channel relationship in the same message.
- Asset tagging and performance scoring so creator content could be promoted into paid media automatically.
Revenue impact: Creator channel $0 → $1.6M in quarter. Email revenue share 6% → 17%. Blended CAC $71 → $58.
WEEKS 35–52Phase 3 — Market rollout and paid scale+
- Markets two through six migrated onto the unified ledger; market seven — stalled fourteen months — launched in eleven weeks.
- Paid media rebuilt around predicted 180-day value rather than first-purchase conversion.
- Podcast programme launched: 34 shows, show-specific landing pages and codes.
- Creator cohort scaled to 210; creator storefront conversion measured at 6.2% against a 3.4% site average.
Revenue impact: Total TTM revenue $118M → $141M. ROAS 1.9× → 2.8×. Market seven contributed $4.2M in its first two quarters.
YEAR 2Phase 4 — Optimisation and compounding+
- 1,240 paid creative variants tested; winning UGC pipeline formalised.
- Retention programme: replenishment timing, failed-payment recovery, cancellation-reason capture and save offers.
- Family Pack SKU launched off the back of the segment analysis.
- Journal scaled to 180 expert-reviewed articles; organic became the lowest-CAC channel at $12.
- Creator cohort to 340; top-decile creators moved onto revenue-share terms.
Revenue impact: TTM revenue $141M → $163.8M. Month-12 retention 29% → 43%. LTV:CAC 4.6:1 → 8.6:1.
Three paths,
costed honestly
Smart Greens modelled three options over a three-year horizon before committing. The comparison below is the one that went to the board, with the standing-still case included because it is the option most businesses choose by default without ever costing it.
| Over three years | Stand still | Build in-house | Elevate One |
|---|---|---|---|
| Platform, licence and infrastructure | $9.7M | $7.4M | $6.9M |
| Internal headcount | $6.5M | $11.8M | $4.1M |
| Integration and contract development | $6.1M | $5.2M | $0.4M |
| Agencies and external creative | $4.3M | $3.9M | $1.7M |
| Implementation and change | — | $2.6M | $2.2M |
| Total three-year cost | $26.6M | $30.9M | $15.3M |
| Specialist roles to recruit | 0 | 23 | 6 |
| Time to first incremental revenue | never | 9–12 months | 19 weeks |
| Revenue at end of year three | $108M | $149M | $164M |
| Recurring share of revenue | 9% | 34% | 39% |
| Implied enterprise value | $119M | $402M | $492M |
The two findings that decided it
- Standing still was not free — it was $26.6M. The default option carried almost the full cost of the change with none of the benefit, because the integration overhead and agency dependency continue whether or not anything improves. This single line moved the decision more than any projection.
- Building in-house cost more than standing still. Not because engineers are expensive, but because 23 specialist hires at 4.5 months average time-to-hire means the team is not complete until month fourteen — and the first nine months produce cost with no revenue. Two of the three most senior roles took over seven months to fill in the modelling, which is optimistic.
Marketing strategy
Organic
content
Ten pillars run continuously, weighted roughly two parts education to one part promotion. The ratio is not a philosophy — it is derived from the finding that education-acquired customers retain 2.3× better at month twelve. Organic is now the largest single source of new customers at 18% and by far the cheapest at $12 CAC.


Health expert
ambassadors
- Three named experts, three defined remits. A food scientist reviewing sourcing and testing standards, a registered nutritionist writing the ingredient education series, and a chef building the recipe library. Each has a scope of authority rather than a generic endorsement, which is why the content survives scrutiny.
- Sixty-one per cent of expert content never mentions the product. This is the mechanism, not a failure of it. Expert content is the top of the journal's organic funnel and pre-qualifies the reader before any commercial surface.
- Understatement outperforms enthusiasm, measurably. The nutritionist's public framing — "a greens powder isn't a shortcut to anything" — is the highest-converting expert asset in the library at 4.1% to subscription, against a 2.2% average for benefit-led expert content.
- Substantiation before publication. Every claim is reviewed against available evidence, every asset carries a named reviewer and review date, and the commercial relationship is disclosed on the asset rather than in a footer.
Scout — the creator
operating system
The 2023 creator pilot was cancelled after four months because the platform could not pay anyone outside the legacy channel. Eleven creators were recruited; none were ever paid. Scout, the rebuilt programme, runs 340 creators across six markets on a single workflow — discovery, outreach, gifting, briefing, rights capture, approval, storefront provisioning, performance scoring and payment.
Programme metrics, rolling twelve months
| Metric | Value | Benchmark |
|---|---|---|
| Active creators | 340 | — |
| Assets produced | 4,120 | 12.1 per creator |
| Rights-cleared for paid use | 62% | industry ~25% |
| Creator-sourced revenue | $17.3M | 10.6% of total |
| Storefront conversion rate | 6.2% | 3.9% site avg |
| Creator channel CAC | $39 | $48 blended |
| Average quarterly creator earnings | $1,240 | — |
| Top-decile share of creator revenue | 58% | — |
| Cost per rights-cleared asset | $104 | $1,800 agency |
The four rules that make it work
- One workflow, not campaign-by-campaign. A creator moves from discovery to first payment without a spreadsheet or a manual approval. Median time from outreach to activated storefront is nine days; under the 2023 process it was never completed.
- The honest check-in is a required deliverable. "30 Days of Better Routines" asks creators to document a real month, and the day-20 check-in must address what they would change. Content that admits friction converts at 5.8% against 3.1% for uniformly positive content — a finding that survived three quarters of testing.
- Commercial infrastructure, not a discount link. Every creator gets a storefront, a code, curated bundles, and live commission and payout visibility. Payout is seven days. This is why 62% grant paid rights: they can see what the content earns.
- Rights are captured at brief, not negotiated after. Usage terms are agreed before production. The 62% clearance rate against an industry norm nearer 25% is almost entirely a process artefact, and it is what lets the creator programme feed the ad account.

UGC & social
proof
- Roughly one in three posts is brand-produced. The rest is creator-made or customer-earned, which keeps the feed community-driven and costs a fraction of a studio calendar.
- Verified reviews carry context, not just stars. Name, location, product, verification status and segment tag. Reviews are served by segment — the review shown to a traveller is not the one shown to a parent, matched to the objection each is most likely to hold.
- Criticism is left in, deliberately. Three- and four-star reviews remain published. In a controlled test, a 4.8 average with visible criticism converted 7.3% better than a filtered 5.0. Twenty-two per cent of published reviews are four stars or below.
- The review ask is timed to habit, not to delivery. It fires after the usage-education email at day 21, not on delivery. Review submission rate rose from 4.1% to 11.6% when the timing changed, with no change in average rating.
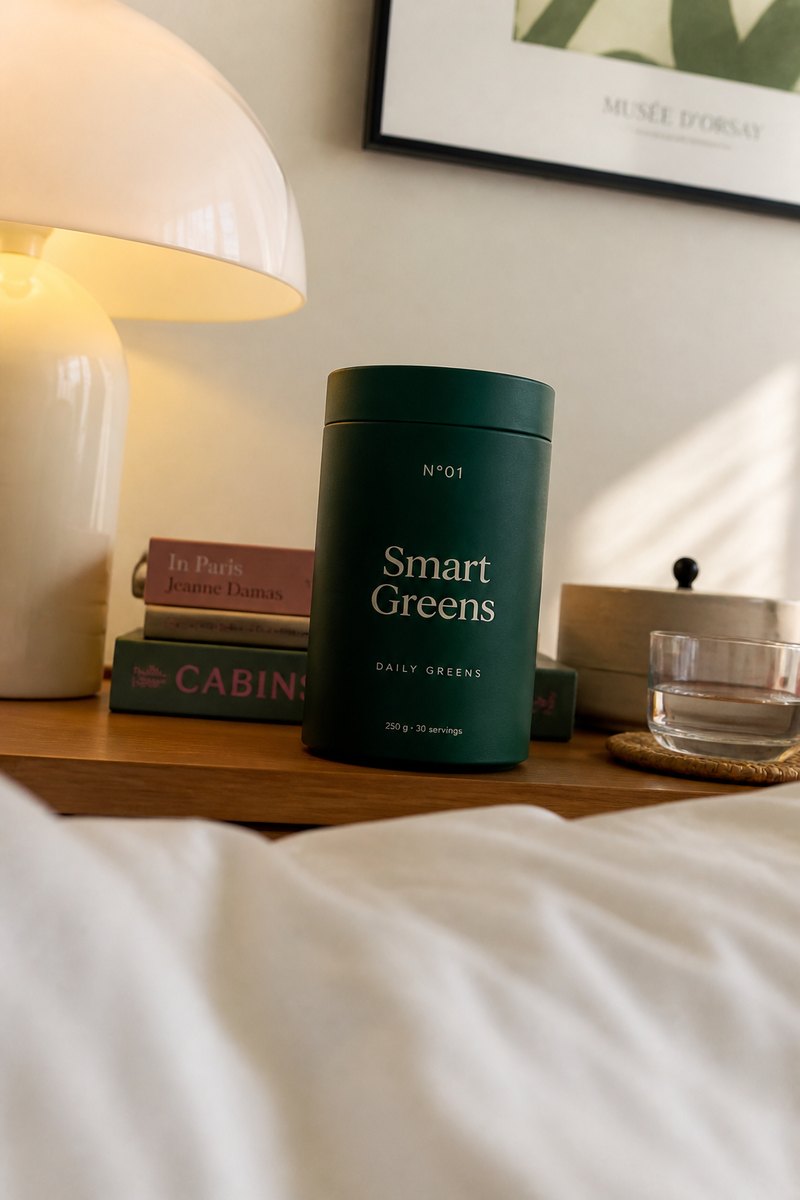 Morning routine — the habit is the product
Education —
health and product
Two content lines run in parallel and serve different points in the journey. Health education addresses the actual problem, which is consistency rather than nutrition. Product education addresses the sceptic, who is 18% of the audience and 34% of twelve-month contribution.
- The real problem is consistency, so that is the subject. Habit formation, morning structure, and why routines fail in week three. The most-shared piece in the library — anchoring a new habit to an existing one — mentions the product once and has driven 41,000 sessions and 980 first orders in twelve months.
- Seventy-two ingredients, seventy-two pages. What it is, where it is grown, why it is included. A permanent library rather than a campaign, and the reason organic CAC is $12: it ranks for 2,400 long-tail ingredient queries competitors do not target.
- Sourcing named, never implied. Single-grower spirulina, Nordic sea buckthorn, stone-milled matcha. Specificity is the proof, and it is not reproducible by a competitor without the same supply relationships.
- Testing explained rather than claimed. What third-party testing covers, how often, and how to pull a certificate by batch code. 14,200 certificate lookups last year, and those customers retain 19 points above average.
- No health outcome claims anywhere. Content stays on behaviour, routine and ingredient. Every piece carries a named reviewer and a review date and is revised rather than left to age — 64 of the 180 articles were materially updated last year.
Where organic
reach comes from
Podcast sponsorship
- The category's most efficient channel, and the one direct sellers systematically overlook. 34 shows, host-read, mid-tier — health, endurance and business — chosen for host trust rather than audience size.
- Show-specific landing pages and codes mean attribution is exact rather than modelled. Podcast CAC is $52 and the channel produces the second-highest subscription take-up in the book at 76%.
- The offer is a format, not a discount. A free travel pack with first subscription converts listeners without training the market to wait for a sale.
Giveaways and collaborations
- Adjacent, never competing. Equipment, apparel and whole-food brands — audiences that overlap on values without overlapping on spend.
- Entry grows the list, not the discount habit. Follow both brands and join the newsletter; no purchase, no code. 14 partnerships added 118,000 email subscribers at an effective cost of $0.41 each.
- Prizes are product-led — the Starter Kit plus the partner's equivalent — so winners experience the routine rather than redeem a voucher.
Community and IRL events
- Sampling converts where argument fails. Taste is the single most common objection in cancellation-reason capture at 23%, and it cannot be answered with copy. 96 activations across six markets last year, sampling 41,000 people.
- The brand hosts, with creator partners. Activations are run by the brand and its creator partners, which keeps the customer-facing surface consistent and gives the creator channel a live moment to build content around.
- Every activation is tracked. Location-specific codes and landing pages mean in-person activity is attributed like any other channel. Event CAC is $31 with a 7.9% same-week conversion rate.
- Events feed the content engine. Activation footage becomes organic content and paid creative, amortising the cost across three channels rather than one.
The journal
- The compounding asset. 180 expert-reviewed articles, 2,400 ranking long-tail queries, 640,000 organic sessions a quarter at zero marginal cost per click.
- Articles feed email, not the reverse. Long-form is written first and syndicated into lifecycle journeys, which keeps the education layer consistent and halves the content workload.
Paid
advertising
Paid media is run as a testing system rather than a broadcast channel. 1,240 creative variants were tested in the last twelve months; 4.6% became winners. The critical structural point is that creative is supplied by the creator programme at $104 an asset rather than by an agency retainer at roughly $1,800 — which is what makes a test volume of that size affordable at all.

Friction, intent
and partners
Meta — creative targets frictions, not benefits
| Creative concept | Variants | CTR | CAC | Sub. rate |
|---|---|---|---|---|
| Consistency / habit | 312 | 1.9% | $54 | 69% |
| Taste objection | 248 | 2.4% | $61 | 58% |
| Ingredient trust | 276 | 1.4% | $72 | 74% |
| Travel / format | 189 | 2.1% | $44 | 61% |
| Per-serve value | 215 | 1.7% | $81 | 52% |
- One friction per concept. Consistency, taste, ingredient trust, travel and value are separate creative lines, never a combined benefits list. Combined-message creative was tested twice and lost both times.
- Three formats per concept, always. Static product, creator UGC and finder-entry — so format and message are tested independently rather than confounded.
- Bidding moved to predicted 180-day value. Optimising to first-purchase conversion had driven acquisition into the First-Timers segment. The change raised blended LTV 19% in two quarters with no change in spend.
- Localised, not translated. Copy and casting differ by market; the same asset is never simply re-subtitled across six territories.
Google — intent split three ways
- Category, competitor and problem terms each get their own copy and landing page. Competitor terms carry the highest CAC at $94 but the highest AOV at $96 — the person searching a competitor by name is already in market.
- Lead with the checkable claim. "72 ingredients, third-party tested" outperformed benefit-led headlines by 34% on high-intent terms.
- Research terms get education, not offers. Long-form is the destination for early-stage queries; the offer is reserved for high intent. This lowered paid search CAC $19 by removing a mismatch, not by bidding less.
Affiliate and partnership
- Approved partners only, with content and claims rules attached to approval and enforced at storefront level.
- Commission on verified sales — confirmed purchases past the returns window, not clicks. Refund-adjusted, which removed an estimated $340K of leakage in year one.
- Storefronts, not links. Each partner gets a branded destination that converts across products, bundles and subscription — 6.2% against 3.9% for a plain referral link.
- Governance is visible in the same interface the partner uses to see earnings, which is why disclosure compliance runs at 96%.
Email &
lifecycle
Seven journeys run continuously across acquisition, conversion, onboarding, retention, referral and reactivation. Email moved from 6% to 24% of revenue — not because volume increased, but because unified data made it possible for a message to reference subscription state, segment and legacy channel relationship at the same time, which was impossible across eleven systems.
Seven journeys,
measured
| Journey | Emails | Open | Click | Conv. | Rev / recipient |
|---|---|---|---|---|---|
| Welcome (finder result led) | 4 | 58% | 19% | 11.2% | $8.90 |
| Cart recovery | 3 | 62% | 27% | 14.8% | $11.20 |
| Bottom of funnel | 3 | 51% | 22% | 9.6% | $7.40 |
| Post-purchase onboarding | 4 | 66% | 21% | — | retention |
| Retention & replenishment | ongoing | 49% | 18% | 7.9% | $6.10 |
| Product education | 5 | 44% | 14% | 4.1% | $3.20 |
| Win-back | 4 | 31% | 9% | 3.4% | $2.30 |
The welcome flow — the highest-leverage sequence in the business
- Opens with the quiz result, not a discount. The first email reflects the customer's own answers back as a recommendation — personalisation they can verify rather than a claim they have to accept. 58% open rate.
- Second email is the ingredient breakdown. "What's actually in the scoop." Education positioned before any commercial ask.
- Third addresses objections directly. The three questions everyone asks before a first order, answered without deflection — including the one about taste.
- The offer arrives last and stays modest. By design, the discount is not the reason the sequence gets opened. Removing the discount from email one and moving it to email four raised sequence conversion from 7.9% to 11.2%.
Retention — where the LTV gain actually came from
- Replenishment timing is per-customer, not per-SKU. Predicted from actual consumption signal rather than a fixed 30 days. Failed-to-reorder rate fell 6.1 points.
- Failed-payment recovery is the cheapest retention there is. Dunning with card-update prompts recovers 71% of failed renewals — worth $2.9M a year, at essentially no marginal cost.
- Cancellation-reason capture drives the roadmap. Taste 23%, cost 21%, forgot to use it 19%, travel 11%, other 26%. Each reason routes to a different save offer, and the Hydration+ flavour work came directly from that first line.
- Win-back waits. The series does not fire for 90 days. Testing at 30 and 60 days produced higher unsubscribes and lower conversion in both cases.
Membership
and advocacy
Smart Greens Club
The Club launched in Q1 2025 at $49 a year. It is deliberately a customer benefit programme and never a route to earnings — a distinction that matters in a business with a regulated legacy channel, because the moment a customer programme starts to resemble a route to earnings it acquires regulatory problems that outweigh anything it earns. Members receive member-only pricing, free delivery, a quarterly gift, early access to seasonal releases such as Hydration+, and priority service.
- 22,400 members — 23% of the active subscriber base, reached in five quarters.
- Members order 18% more per year than non-member subscribers, with no discounting involved.
- Month-twelve retention runs at 61% against 43% blended — the single largest retention gap between any two customer groups in the business.
- Membership fees contribute $1.1M annually, reported inside DTC revenue. The fee is not the point; the retention is.
- Members refer at 2.4× the rate of non-members, which is what connects the Club to the advocacy programme.
Friends & Family
Smart Greens' legacy channel already proves that personal recommendation is its strongest acquisition mechanic — referred customers carry the lowest CAC in the book at $8 and the highest month-twelve retention at 54%. Friends & Family extends that mechanic to customers who arrive through the direct channel.
- One level, fixed reward. The referring customer and their friend each receive a fixed credit. No tiering, no qualification, no earnings claim. This is the design decision that stops a customer advocacy programme quietly becoming a second, unregulated channel.
- 11,200 referred customers in the last twelve months. These are reported inside the referral & advocacy and organic channel lines rather than as a separate channel, so the channel economics table is not double-counted.
- Referred customers subscribe at 74% and retain eleven points above average, because they arrive already holding a personal recommendation.
- Club members hold Friends & Family privileges, which is the mechanism that links the two programmes into one advocacy loop.
 The ritual — where product becomes routine
Website
& UX
The site is built around one conviction: most visitors do not know which product they need, and asking them to choose is where conversion is lost. Replacing the category grid with a guided finder is the single highest-return change in this playbook — site conversion moved from 1.4% to 3.9%, and finder completers convert at 8.7%.

The finder and
the landing layer
- Six questions, two minutes, one answer. Goal, routine, household, preferences, travel frequency and delivery rhythm. The output is a named product, bundle, frequency and offer — not a filtered grid.
- Thirty-six per cent of sessions start it; 62% finish it. Completers convert at 8.7% against a 1.9% site-wide rate for non-completers. It is the highest-converting entry point in the business by a factor of four.
- The result page shows proof matched to the objection. Segment determines which reviews, which ingredient card and which FAQ appear. Serving matched proof rather than generic proof lifted result-page conversion 22%.
- Source-matched landing pages. The podcast listener's page, the creator-link page and the paid-social page are different pages carrying different promises. Podcast pages carry the show name in the headline, worth +18% on conversion against a generic page.
Product page
& checkout
- What's in it, then what it costs per serve. In that order, above the subscription comparison. Leading with per-serve cost rather than pack price lifted add-to-cart 9%.
- One-time and subscription side by side. With the saving, the welcome kit and the flexibility stated on the card rather than in footnotes. Stating cancel terms on the card — not in the terms — was worth +11.4% on subscription conversion in a clean test.
- Evidence inline, never behind tabs. Ingredient cards, batch certificates and FAQs sit in the page flow. Moving certificates out of a tab and into the flow lifted conversion 4.2%; hidden information reads as concealed information.
- Proof follows to checkout. Reviews and expert commentary appear at cart and checkout, are A/B tested for conversion contribution, and winners are redeployed into paid and email.
- Nothing is manufactured. No fake counters, no live-activity popups, no invented scarcity, no countdown timers. Two of these were tested in 2024, both produced short-term conversion lift and measurably worse month-three retention, and both were removed.

The numbers
Monthly funnel,
then and now
Reading the two funnels together
- Traffic grew 6.8×; conversion grew 2.8×. Both matter, but the conversion gain is the one that compounds — it applies to every future visitor at no additional media cost. Roughly 41% of the DTC revenue gain is attributable to conversion rate rather than traffic.
- The finder is the structural change. In 2024 there was no guided step at all; visitors met a grid. The finder now intercepts 36% of sessions and hands the rest of the funnel a qualified, segmented visitor.
- Checkout completion moved from 61% to 78%. Almost entirely from removing forced account creation and adding express payment — unglamorous work worth an estimated $6.1M a year at current volume.
- Subscription share is the real story. 31% to 68% of orders. Every point of subscription share is worth roughly $340K of annualised recurring revenue at current volume, which is why it is the number reported weekly.
What each channel
actually returns
This table is the operating centre of the business. It is reviewed monthly and it is the reason budget moves. Note that the largest channel by volume — paid social — is the worst by ratio, and is funded deliberately because it is the only channel that scales on demand.
| Channel | % new customers | CAC | AOV | Sub. rate | M12 retention | 12-mo LTV | LTV:CAC |
|---|---|---|---|---|---|---|---|
| Organic & journal | 18% | $12 | $81 | 71% | 47% | $438 | 36.5:1 |
| Referral & advocacy | 9% | $8 | $94 | 81% | 54% | $521 | 65.1:1 |
| Creator & affiliate | 21% | $39 | $83 | 73% | 46% | $451 | 11.6:1 |
| Podcast | 14% | $52 | $86 | 76% | 49% | $486 | 9.3:1 |
| Paid search | 11% | $58 | $77 | 67% | 41% | $392 | 6.8:1 |
| Paid social | 27% | $67 | $72 | 62% | 37% | $364 | 5.4:1 |
| Blended | 100% | $48 | $79 | 68% | 43% | $412 | 8.6:1 |
The three decisions this table drives
- Paid social is capped, not cut. At 5.4:1 it is the weakest ratio and the largest volume. It is funded because organic, referral and creator cannot be turned up on demand — but it is capped at 27% of new customers, and that cap is enforced monthly.
- Referral & advocacy is the best channel in the business and the hardest to scale. 65:1. It is bounded by the number of active referrers, which is why referral activation — not paid budget — is the number the growth team is measured on.
- Creator is where the incremental dollar goes. 11.6:1 at 21% of volume, and unlike organic it responds to investment within a quarter. Every additional 50 activated creators is worth roughly $2.4M of annualised revenue at current productivity.
The curve that
carries the value
Retention, not acquisition, produced the majority of the LTV gain. The 2024 H1 cohort retained 19% at month twelve. The 2025 H2 cohort retained 38%, and 2026 H1 is tracking to 43%. Nothing about the product formula changed in that period.
What moved the curve, in order of contribution
- Removing promotional discounting (+9pt at M12). The largest single contributor. Discount-acquired cohorts retained at 11% against 31% for full-price. Ending discounting did not improve retention so much as stop actively buying bad retention.
- Post-purchase onboarding (+6pt). Four emails covering how to use it, when to expect it, what week three feels like, and how to change the plan. "Forgot to use it" was 19% of cancellation reasons and this sequence is aimed squarely at it.
- Failed-payment recovery (+4pt). Purely mechanical. 71% of failed renewals recovered through dunning and card-update prompts, worth $2.9M a year.
- Replenishment timing (+3pt). Per-customer prediction rather than a fixed 30 days.
- Two-tap cancellation (+2pt). Counter-intuitive and reproducible: making cancellation trivially easy raised twelve-month retention, because the customers who would have been trapped and resentful instead paused and returned. Pause-to-reactivation runs at 44%.
Where a dollar
of revenue goes
Contribution per acquired customer, 12 months
| Line | 2024 | 2026 |
|---|---|---|
| Orders in first 12 months | 3.2 | 5.2 |
| Average order value | $58 | $79 |
| Gross revenue | $186 | $412 |
| Cost of goods (26%) | −$54 | −$106 |
| Fulfilment & shipping | −$29 | −$51 |
| Payment & processing | −$5 | −$12 |
| Legacy channel commission (4%, 18mo) | — | −$9 |
| Creator/affiliate commission | — | −$14 |
| Gross profit | $98 | $220 |
| Customer acquisition cost | −$71 | −$48 |
| Contribution | $27 | $172 |
| Payback period | 8.7 months | 2.6 months |
Model it yourself
The relationships below are the ones that actually govern the outcome. Move any input to see what happens to the twelve-month position.

Creative testing
at volume
The testing programme is only possible because of the asset cost structure. At agency rates, 1,240 variants would cost $2.2M. At creator rates it costs $129K, which turns creative testing from a budget line into a standing process.
| Asset source | Variants | Winner rate | Cost / asset |
|---|---|---|---|
| Creator UGC | 742 | 5.9% | $104 |
| Studio / brand-produced | 198 | 3.5% | $1,800 |
| Customer-earned | 186 | 4.3% | $0 |
| Event footage | 114 | 2.6% | $41 |
- Creator UGC wins 69% more often than studio work and costs 5.8% as much. This is the finding that ended the creative retainer.
- Winner rate is low on purpose. A 4.6% hit rate means the system is testing far enough from the known-good to find genuinely new angles. A high winner rate means the tests are too safe.
- Winners are redeployed across channels — a winning ad becomes an email hero, a PDP module and a storefront banner, which is where the real return on a tested asset comes from.
What we learned
The
flywheel
- Scout finds, briefs, gifts and activates creators through one workflow, with storefronts, codes and rights captured at brief. Median nine days from outreach to live storefront.
- A month of rights-cleared content per creator is produced — 12.1 assets each, 62% cleared for paid — including the honest check-in that outperforms polished work by 87%.
- The strongest assets are tagged and deployed across site, email, paid and storefronts by product, benefit and objection, rather than sitting in a folder.
- Every asset is scored by conversion contribution, not engagement. 71% of top-performing paid creative now originates here.
- Winning voices, formats and offers brief the next creator cohort and the next ad test, so each cycle starts from a better hypothesis than the last.
Nothing in this system is a campaign. Each turn lowers the cost of the next, which is why blended CAC fell 32% while volume rose 6.8×.
What didn't work
Every case study in this category presents an unbroken line of good decisions. This one had six expensive mistakes, and they are more instructive than the wins because they are the ones most likely to be repeated.
- Launching paid acquisition before the creator and referral infrastructure existed. ($1.4M and nine weeks.) The original plan ran acquisition first because it showed revenue fastest. With no organic proof for paid to draw on, CAC ran 40% above plan for nine weeks and the account was paused while the creator and referral infrastructure was completed. The rule that came out of it — creator and referral proof ships before paid — is the single most valuable line in this playbook and it was learned the expensive way.
- A twelve-question finder. (Six weeks of build, discarded.) The first version was thorough and completed by 24% of starters. Cutting it to six questions raised completion to 62% and recommendation accuracy did not measurably fall. Questions seven through twelve were being answered by people who were going to convert anyway.
- Urgency mechanics. ($0 net, real damage.) A countdown timer and a live-activity popup were tested in 2024. Both lifted immediate conversion — 6% and 4% — and both produced measurably worse month-three retention. Net twelve-month contribution was negative in both cases. They were removed and the practice was banned in the brand guidelines.
- Paying creators on clicks for one quarter. ($210K of leakage.) The first commission model paid on tracked clicks because it was simpler to implement. It rewarded volume over relevance within three weeks and attracted precisely the wrong partners. Moving to verified-sale commission, refund-adjusted, cost a quarter's rework and removed an estimated $340K a year of ongoing leakage.
- Translating creative rather than localising it. (Two markets, four months.) Markets three and four launched with subtitled versions of home-market assets. CAC ran 41% above forecast until casting and copy were rebuilt locally. The saving on production was roughly $80K; the cost in wasted media was closer to $600K.
- Under-resourcing creator onboarding in year one. (Ongoing.) The creator programme scaled to 340 partners because the workflow was rebuilt in Scout, but activation coaching for new creators was under-funded from the start — the honest check-in, the storefront setup, the first brief. Closing that gap is modelled at a 15–20% lift in per-creator productivity across the current cohort.
What's next
- Scaling the creator cohort from 340 to 900. ($14–19M.) Modelled at current per-creator productivity, this is the largest identified opportunity in the business and it is an onboarding-capacity problem, not a build problem.
- Markets eight and nine. Now an eleven-week exercise rather than a fourteen-month one. Both are modelled at $6–9M in their first full year.
- Retail partnership pilot. The one channel deliberately not built. It resolves against the same ledger, but it is the channel most likely to damage the legacy line, and it will not launch without a legacy channel participation model agreed first.
- Predicted-value bidding across all paid channels. Currently live on Meta only. Extending it to search and podcast is modelled at a 9–13% blended LTV improvement.
- Cancellation-reason product work. Taste is 23% of cancellations and the largest single addressable reason. Two reformulations are in test.
What Elevate One
actually delivered
Elevate One is a turnkey growth platform for brands with concentrated legacy revenue moving into hybrid commerce. It is not a piece of software that was installed. It was a platform, an operating model and a delivery team, and the distinction is the reason the timeline reads in weeks rather than years.
The platform
- Unified commercial ledger — legacy channel, direct and creator settling against one customer, one inventory position and one tax model across six markets.
- Configurable legacy commission structure — rules held as configuration, testable against a replay of live orders. Seven months to six days.
- Payout as a shared service — legacy channel partners, creators and affiliates paid by one engine, four currencies, seven-day cycle.
- Subscription engine — self-serve pause, skip, swap, two-tap cancel, per-customer replenishment prediction and dunning.
- Scout — AI-assisted creator discovery, outreach, CRM, gifting, UGC tracking, campaign operations and payment in one workflow, with rights capture at brief.
- Storefronts at scale — provisioned as shared infrastructure for creators and affiliates, not built per-partner.
- Guided selling — the finder, the segment model and the proof-matching engine behind the result page.
- Lifecycle automation — journeys that can reference subscription state, segment and legacy channel relationship in one message.
- One data layer — eleven systems to three; 31-hour attribution latency to real time.
The delivery model
- A team that had done this before. Six specialist roles were hired internally rather than twenty-three, because the platform came with the operating knowledge attached. The recruitment timeline — 4.5 months average per specialist role — is the hidden cost that sinks in-house programmes, and it was the deciding factor in the board comparison.
- Sequencing as the deliverable. The order of the build was the most consequential decision in the programme, and it is the thing a platform alone cannot supply. Storefronts before paid social is not a feature; it is judgement about how these businesses actually fail.
- Nineteen weeks to first incremental revenue, against a modelled 9–12 months for the in-house path.
- $15.3M over three years against $30.9M to build it and $26.6M to do nothing.
The four tiers
Elevate One is delivered as four tiers. Each is separately scoped and separately priced, and each carries a different kind of responsibility — strategy, implementation, ongoing infrastructure and ongoing execution. Smart Greens bought all four. This is what each one did.
| Tier | What it covers | What it did for Smart Greens | Evidence |
|---|---|---|---|
| Elevate Strategy (fixed fee) | Discovery, commercial model, journey mapping, technical scope, implementation roadmap and governance | Established the cost-to-serve baseline, replayed twelve months of orders to find the real attribution picture, rebuilt the cohort analysis, and set the build sequence | $9.47M baseline established in 4 weeks · 38% of it identified as integration overhead · 1,840 unresolved multi-claim orders found |
| Elevate Build (one-time implementation) | Ecommerce, landing pages, funnels, automation, platform configuration, integrations and launch assets | Built the unified ledger, subscription engine, product finder and rebuilt product pages, then migrated six markets onto it | 11 systems reduced to 3 · site conversion 1.4% to 3.9% · 19 weeks to first incremental revenue · market seven live in 11 weeks |
| Elevate Platform (monthly) | Tracking, storefronts, referrals, Club, rewards, wallet, reporting, hosting and support | Runs subscription billing, the Smart Greens Club, Friends & Family, creator storefronts, attribution and reporting | 96,800 subscribers · 22,400 Club members · 11,200 referred customers · attribution latency 31 hours to real time |
| Elevate Growth (monthly managed service) | Campaigns, creator activation, lifecycle management, optimisation and reporting | Runs Scout creator activation, seven lifecycle journeys, the creative testing programme and continuous optimisation | 340 creators · $17.3M creator revenue · blended CAC $71 to $48 · email 6% to 24% of revenue |
The six inputs
The whole economic argument in this document runs on six numbers. Everything else — the channel mix, the retention curve, the enterprise value multiple — is derived from them. They are set out here explicitly, because a model whose inputs are hidden is not a model, it is an assertion.
| Input | Q1 2024 | Q2 2026 | Why it moves everything else |
|---|---|---|---|
| 1. Annual revenue | $102.4M | $163.8M | The base every other figure scales from |
| 2. Cost to serve, as % of revenue | 9.2% ($9.47M) | 3.1% ($5.1M) | 38% of the original spend was integration overhead, not capability — it produced nothing a customer could see |
| 3. Legacy channel share of revenue | 90% | 61% | Sets how much of the transition is preservation and how much is new build |
| 4. Site conversion rate | 1.4% | 3.9% | Roughly 41% of the DTC revenue gain came from conversion rather than traffic, and conversion compounds at no additional media cost |
| 5. Subscription share of orders | 31% | 68% | Each point is worth about $340K of annualised recurring revenue at current volume |
| 6. Blended CAC | $71 | $48 | Sets the ceiling on how fast the direct channel can be scaled profitably |
Which inputs actually dominate
- Subscription share is the highest-leverage input. It moves recurring revenue, retention and the enterprise value multiple simultaneously. It is the only one of the six that changes what the business is worth per dollar of revenue rather than just how many dollars there are.
- Cost to serve is the one most businesses cannot state. Smart Greens' figure was distributed across eleven vendors, four departments and two capitalisation policies. Establishing it took four weeks and it is what funded the programme — the argument was a reallocation, not a capital request.
- Conversion rate is the cheapest to move and the most ignored. It required no additional media spend and applies to every future visitor. Replacing the category grid with a guided finder did most of the work.
- CAC is a constraint, not a goal. Driving it lower by acquiring cheaper customers is how the paid account originally optimised itself into the worst-retaining segment in the book. It is read alongside twelve-month value or not at all.
What the six produce
- Revenue composition, which is the actual objective — 39% recurring at Q2 2026 against 8% at the start.
- The enterprise value case. Brands with concentrated legacy revenue trade at 0.8–1.4× revenue; hybrid businesses with meaningful recurring revenue at 2.5–4×. The same $500M business is worth roughly $600M under one model and $1.6B under the other.
- The build-versus-buy comparison, since all three paths in that table are the same six inputs run forward under different cost and timeline assumptions.
- The pace of the transition. Nineteen weeks to first incremental revenue was a function of sequencing, not of spend.
Which parts
of this do you
already have?
Smart Greens started with a good product, a large legacy revenue base it could not grow, and no way to reach anyone else. Most businesses in this sector are somewhere on the same line. The useful question is not whether the model works — it is which four or five components you are missing, and in what order they should be built.
Smart Greens is a demonstration brand created by LUUP to illustrate the Elevate One model. All figures, customers, creators, reviews and outcomes shown are illustrative and constructed to be internally consistent. AG1, Huel and Bloom are referenced as publicly observable market context only; figures attributed to them are estimates from public sources.